DSPAUT

DSViewer
PC PAUT PROGRAM - DSViewer
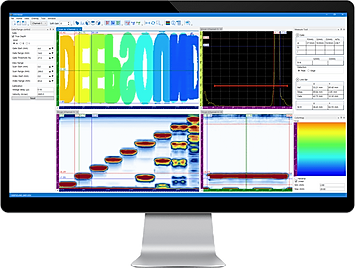
DSViewer reads all the collected data and utilizes various functions for analysis and examination.
It supports various functions such as measuring defect size, locating defect position, and zooming in for closer inspection.
DSVIEWER DATA FILE LOAD
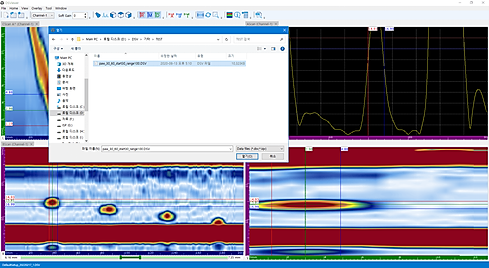
DSViewer loads and displays collected data on the screen.
DEEPSOUND's data files are in DSV format. All collected data will be saved as a .dsv file.
SCAN View Add

Viewer provides a menu for users to configure their desired scan view.
A total of 5 scans are supported: S/A/B/C/D. Click on the desired scan to apply it immediately.
SCAN Add Image

Select and drag the scan window you wish to reposition.
VIEW MENU

The view menu contains functions that displays defect information on the screen.
Such functions include Bar/Gate/Flip/Swap/Zoom Reset.
REFERENCE / MEASUREMENT BAR

Select the desired bar in the View menu to enable it. The defect size can be measured with the cursor and you can check the data values in greater detail in Information.
Enabling Display Values will show the position value of the bar on screen, and disappear when disabled.
VIEW GATE MENU

You can select which gates to enable in the View menu. Enabling a gate will apply it to the A-scan image, and you can freely change the signal position, height, and the desired region to examine.
The length and height of the gate can be changed using mouse controls, but the length can also be modified through the Gat/Range Control tool in the top menu.
VIEW RANGE MENU

When View Range is enabled, an area under the Ruler is created that can be controlled in B-scan/D-scan.
The color of the area expresses the same axis as the color of the ruler and you can control the area to be viewed so that it only displays the target defect you wish to examine.
ZOOM IN / RESET CONTROL

Zooms into or the data image or resets the image to its original size.
You can select the area to magnify by holding Shift+LMB and dragging across the desired area.
Zoom Reset will only affect the selected screen/window.
COLOR MAP TOOL
Color Map is a function that allows you to
see the color area of an image at a glance.
MEASUREMENT TOOL

The Measruement Tool allows the user to see all bar and gate information gathered from the image at a glance.
It is configured to display information about the signal applied to the gate, the distance between gates A and B, and the difference in position values of the reference bar and the measurement bar.
OVERLAY MENU
The Overlay Menu is a function that can call up the image of the inspection target on the screen and apply and reconfigure specimen and weld shapes that were used/saved when collecting data.
SPECIMEN TOOL
Specimen Tool window is used to edit the specimen thickness parameter that was saved during data collection.
WELD SETTING TOOL

The Weld Setting Tool is used to modify a saved weld configuration. You can apply V, Reverse V, and X welds to S-scan and C-scan images.
SAVE PNG TOOL


DSViewer has the option to save images as PNG files.
CHANNEL GROUP VIEWER

The Channel Group Viewer can display all datasets collected by multiple probes.
LINEAR SETTING SCAN IMAGE

The differences in thickness can be clearly seen when scanning with the Linear Setting, and the desired position value can be checked by clicking on the Information icon and moving the data bar.
THICKNESS MEASUREMENT SETTING

DSViewer displays different colors for signals in different locations of varying thicknesses.
PROJECT C-MAP MODE